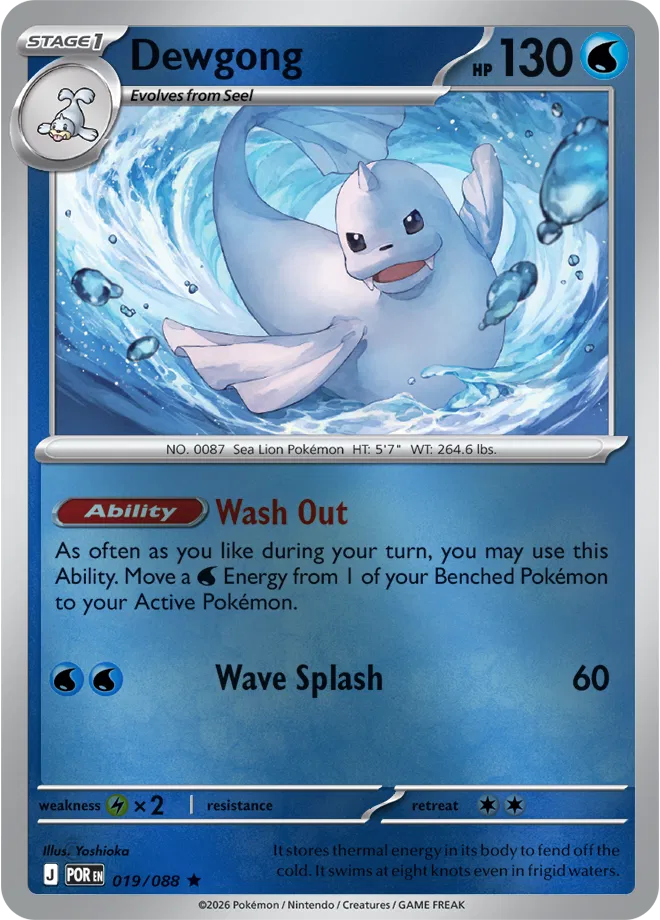
a thought experiment
Does the human brain
know which Pokémon cards
are valuable?
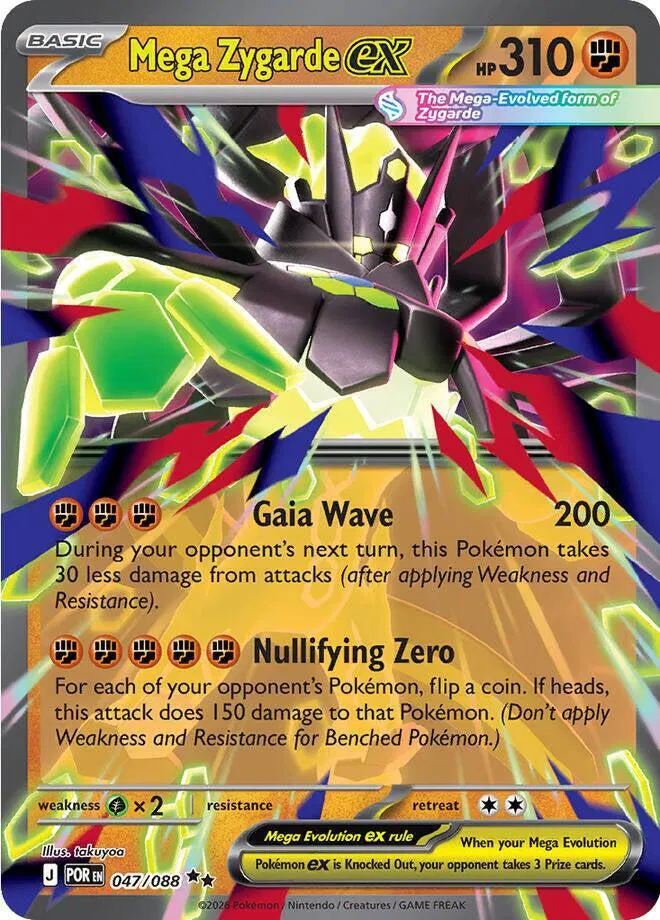
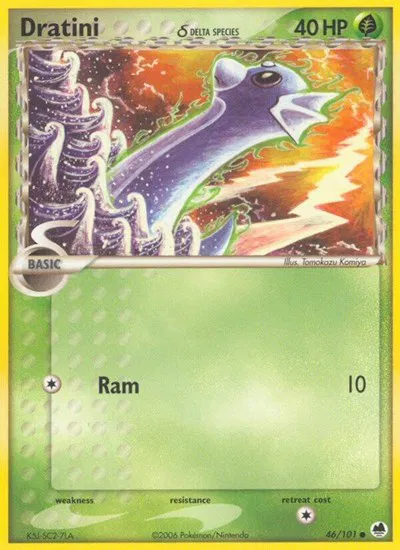
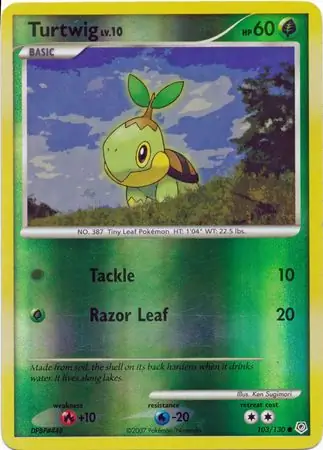
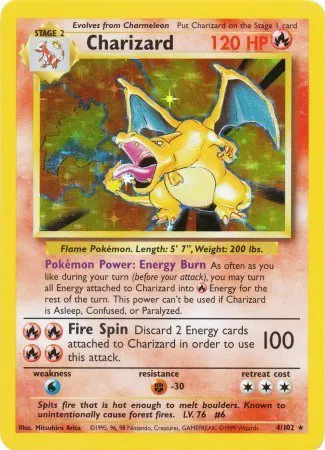
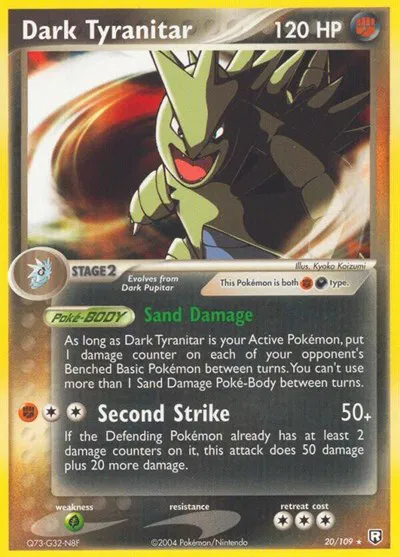
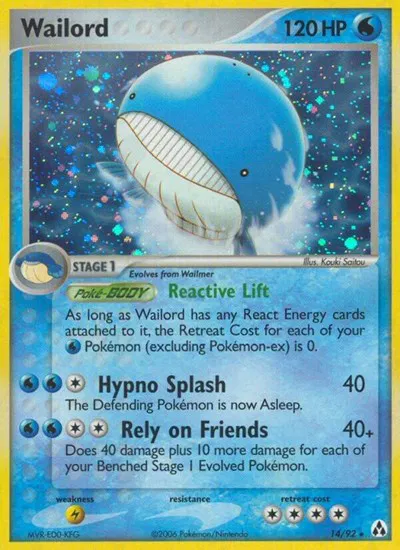
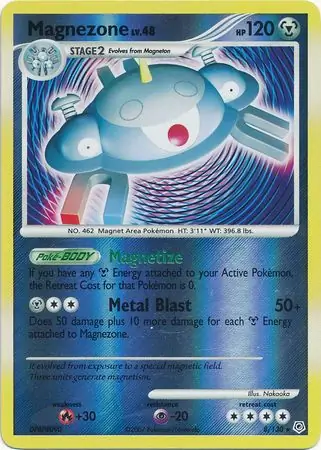
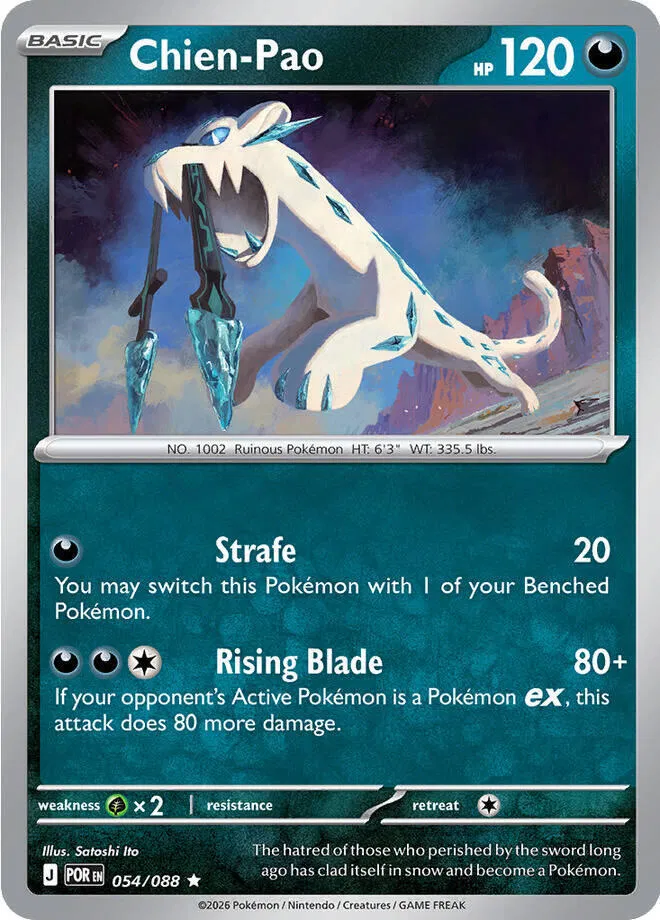
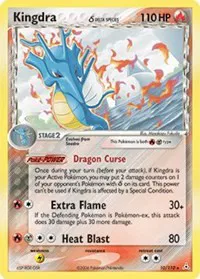
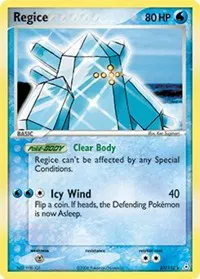
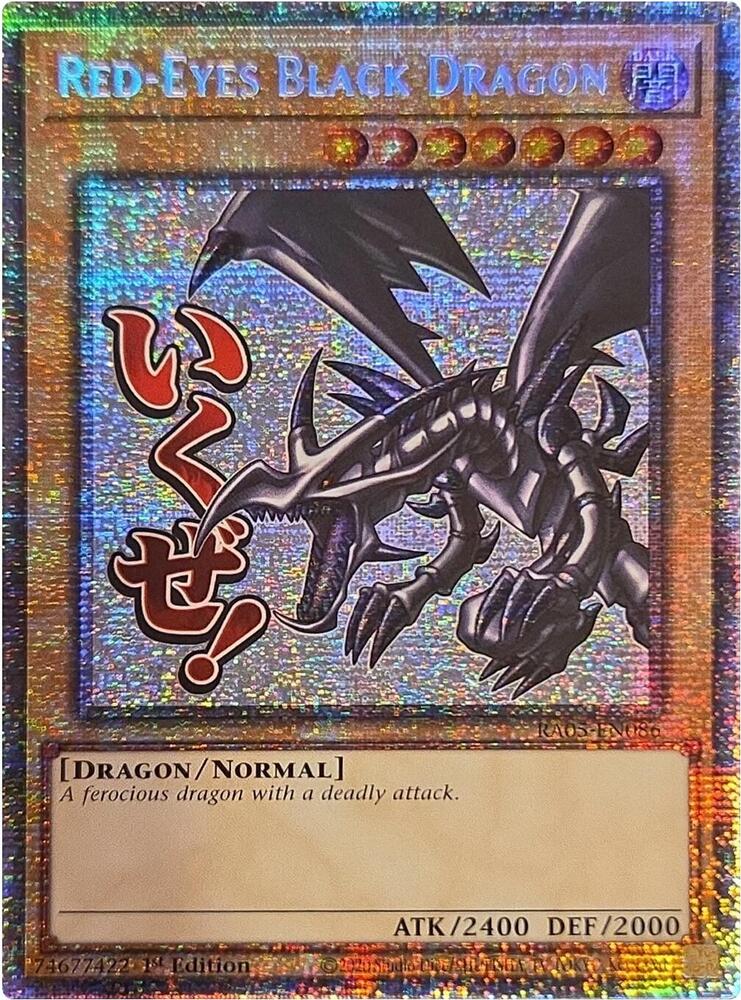
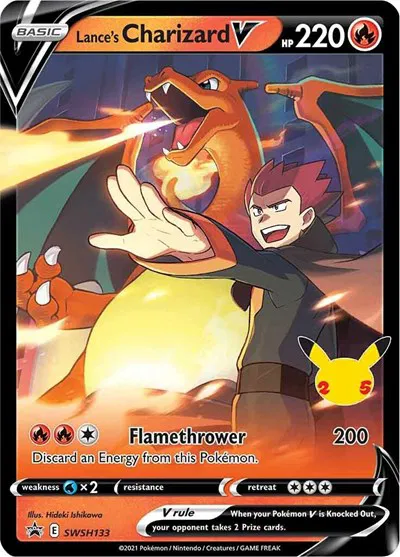
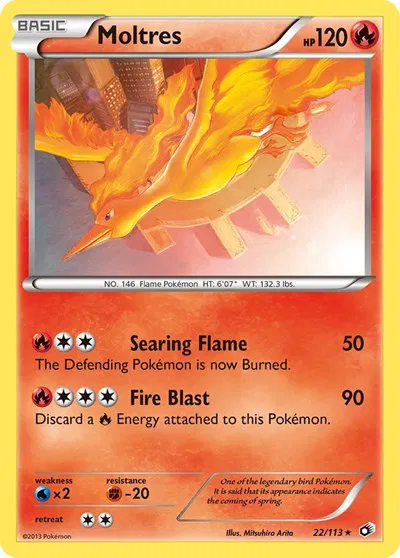
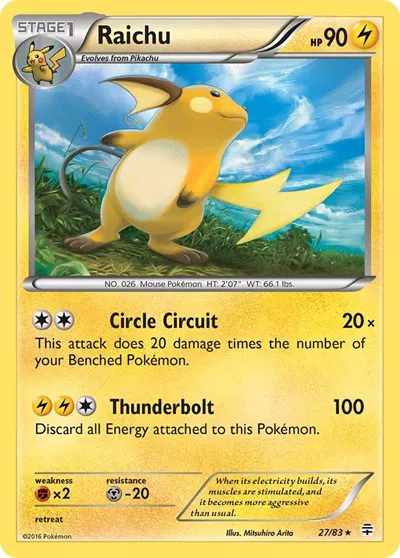
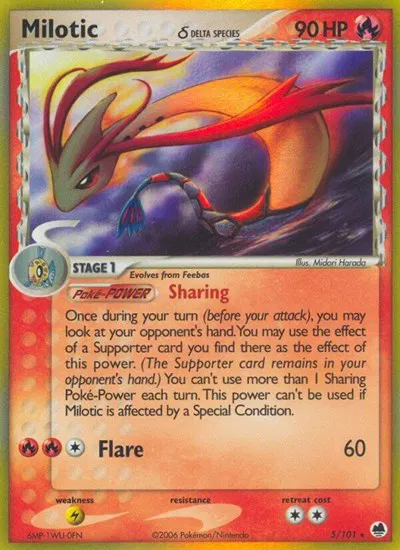
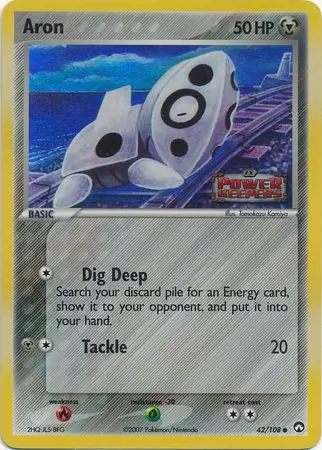
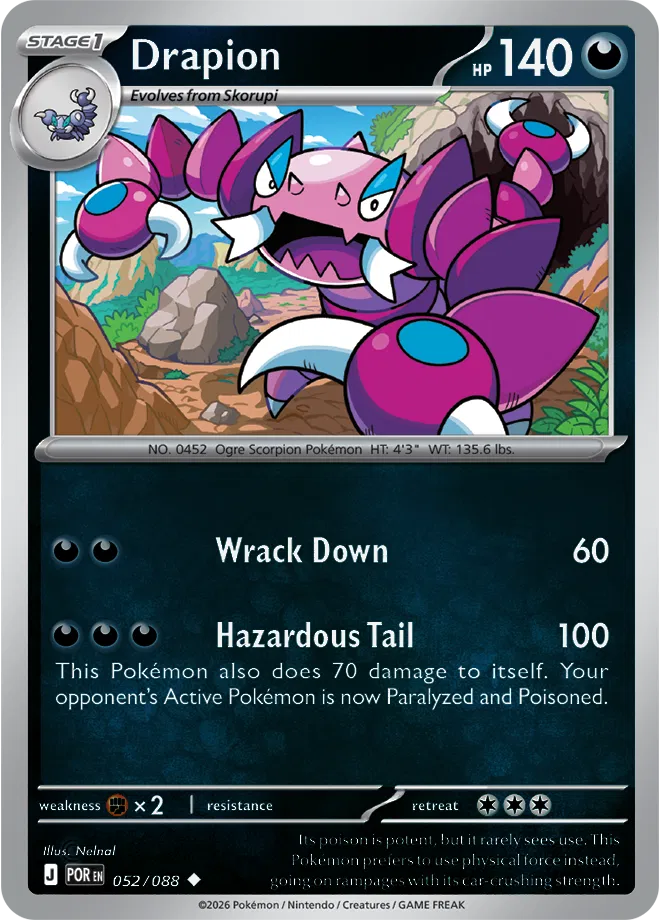
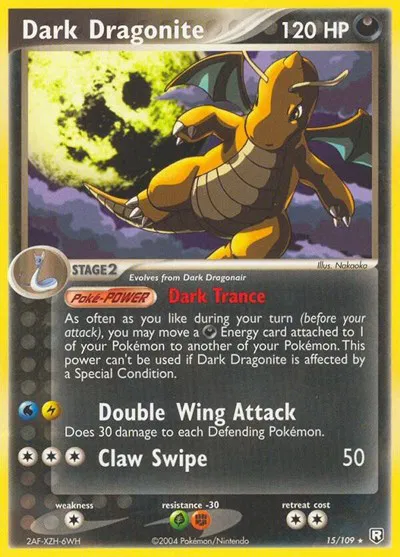
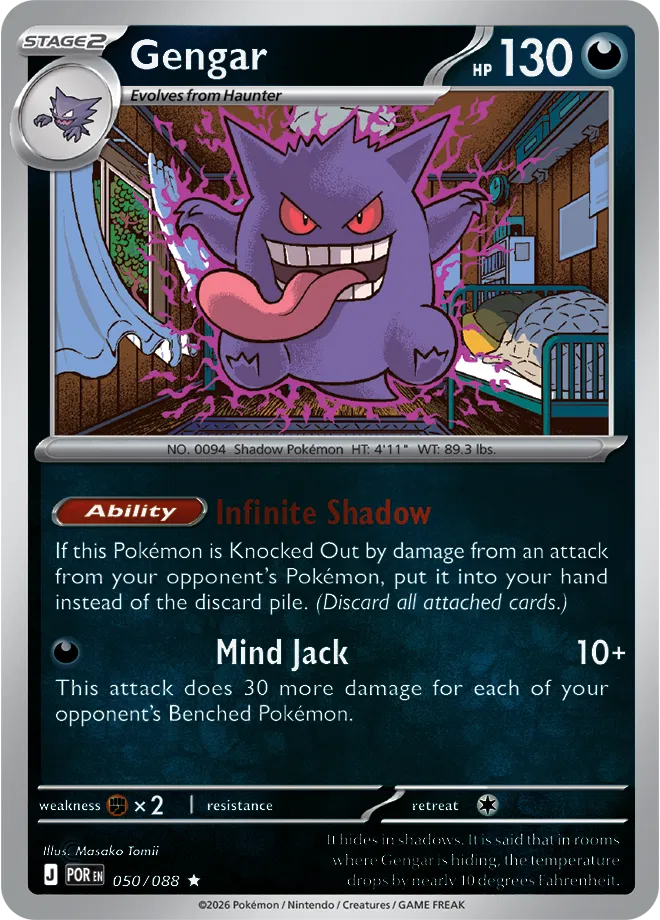
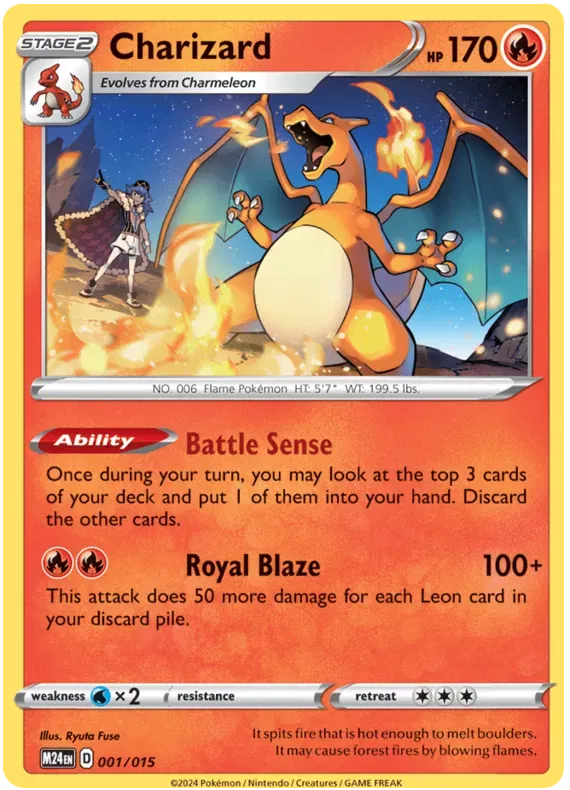
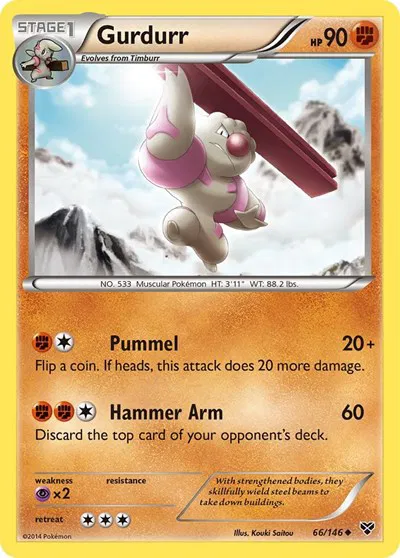
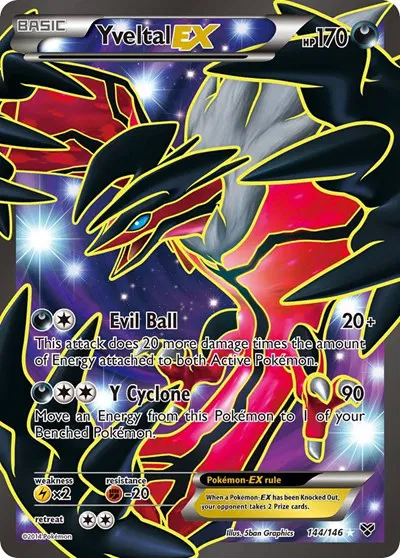
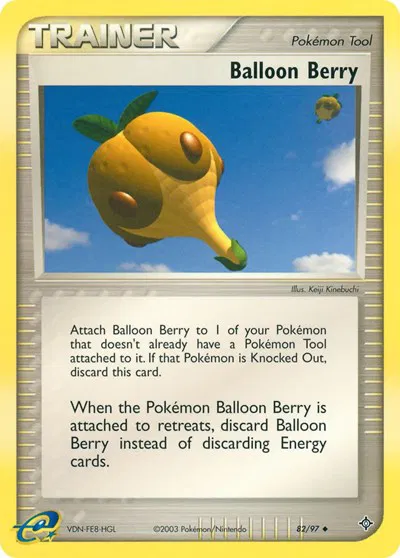
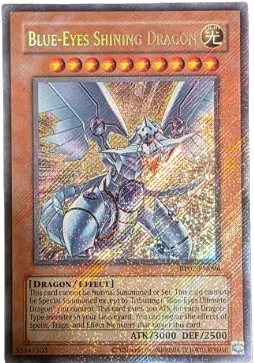
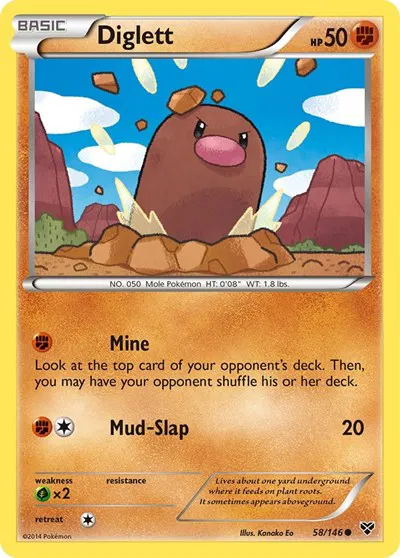
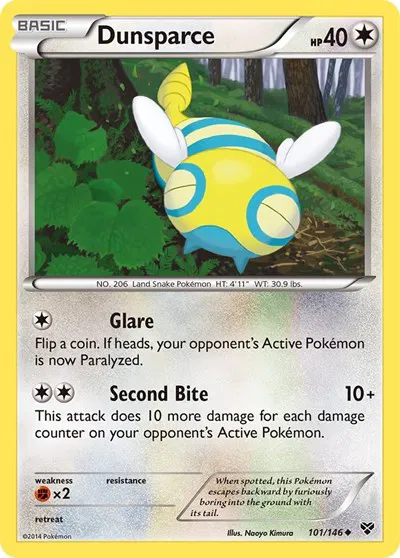
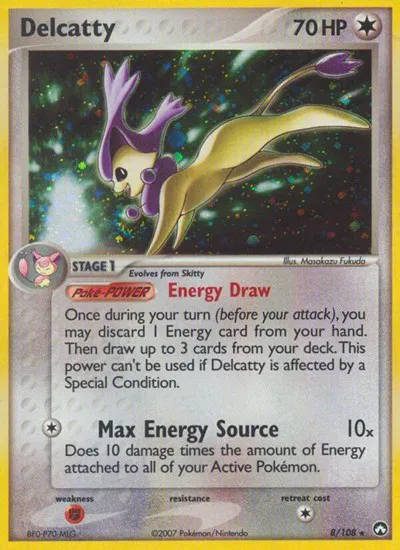
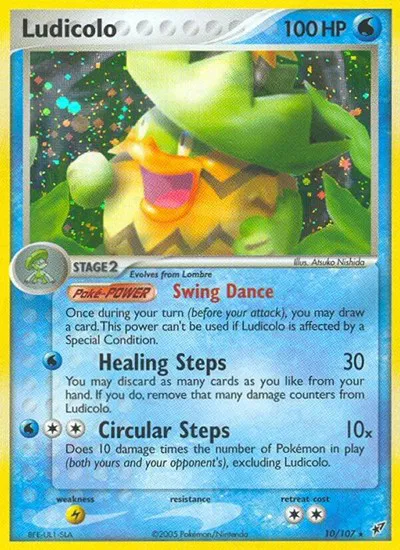
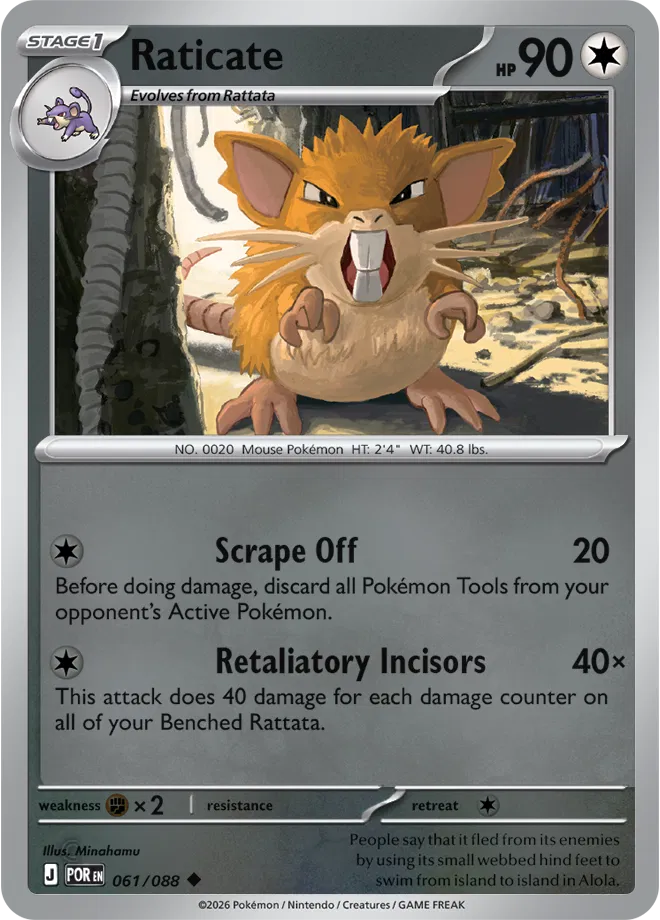
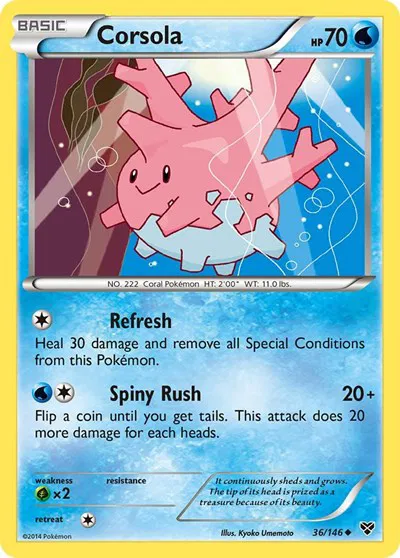
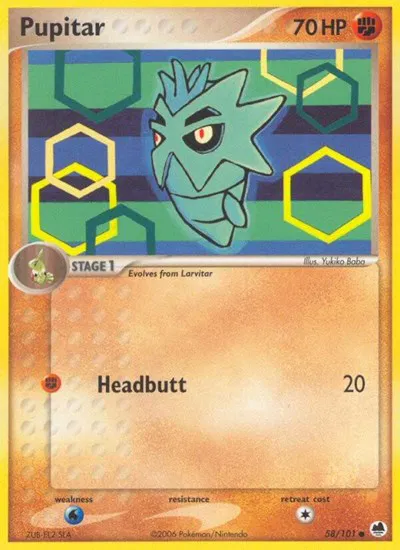
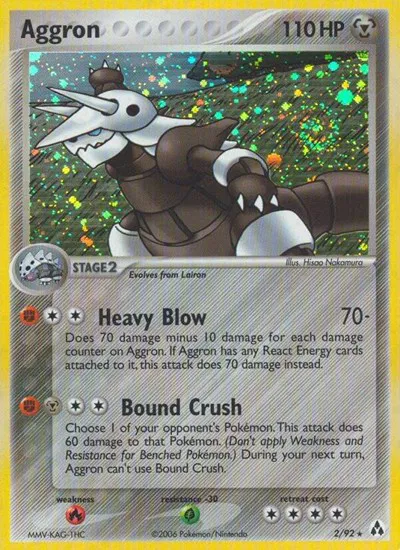
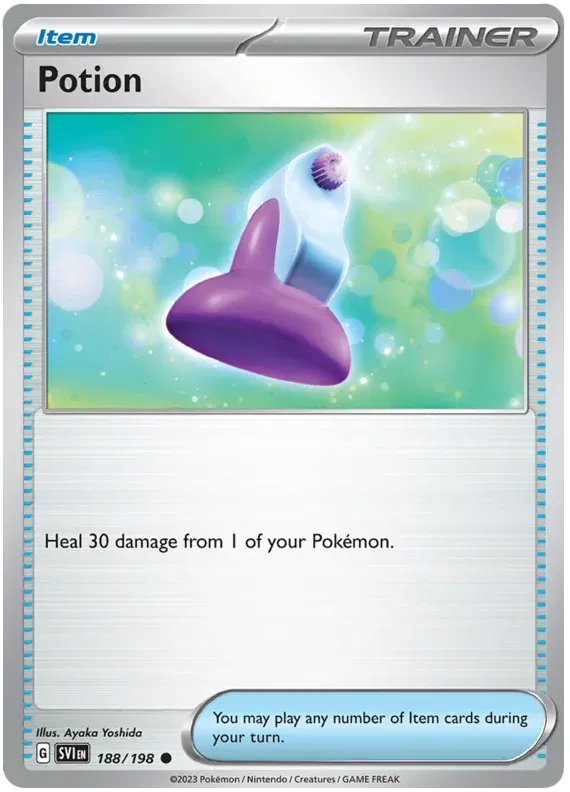
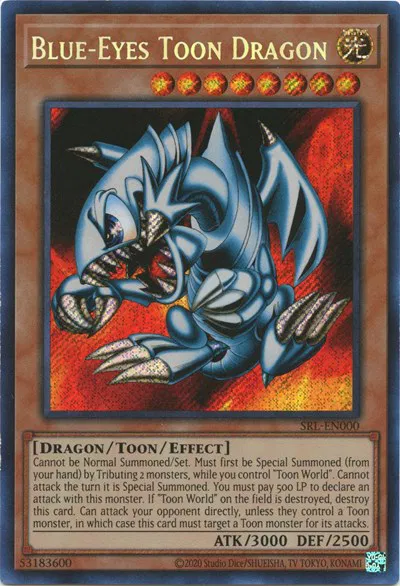
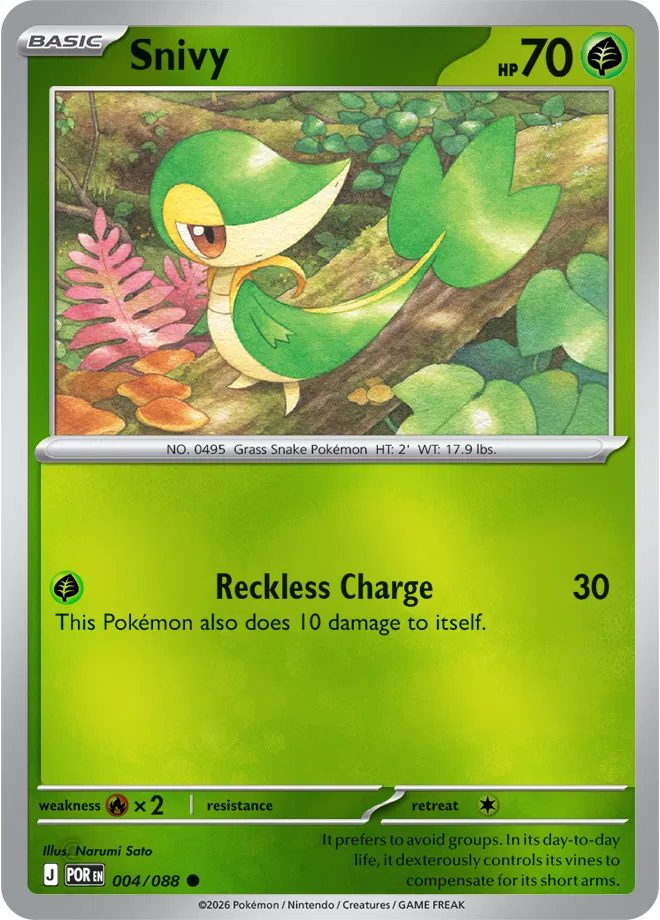
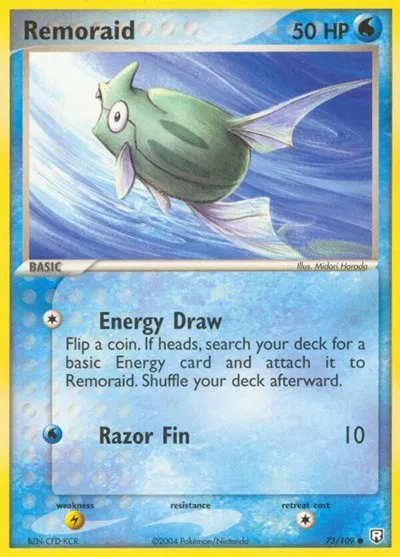
Each card in my Collectr portfolio was fed through TRIBE v2, Meta's foundation model that predicts what a human brain would do when looking at an image. Then I asked whether the predicted brain activation correlates with what the card sells for.
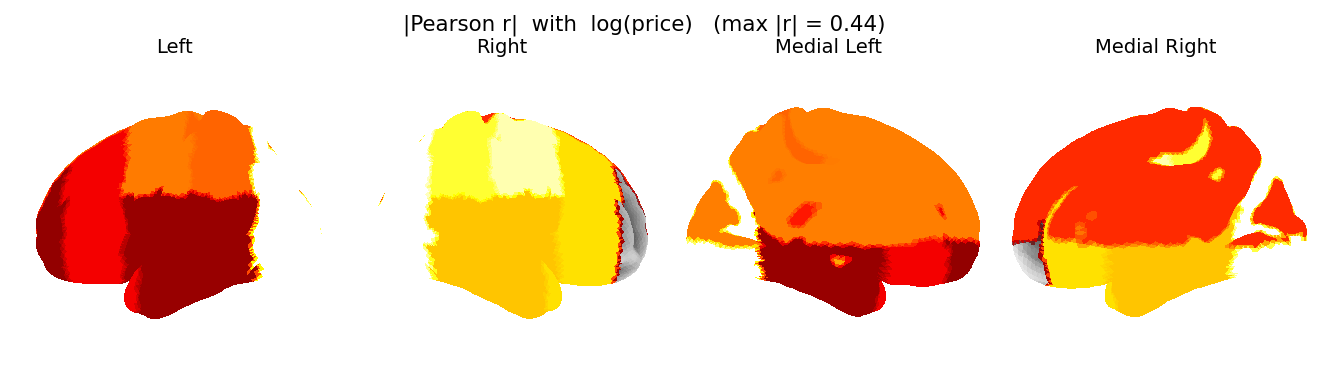
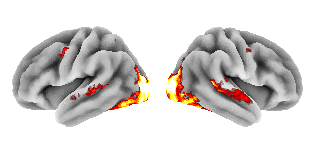
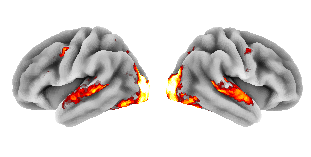
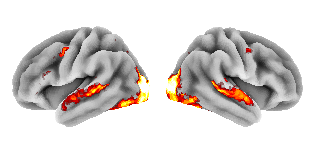
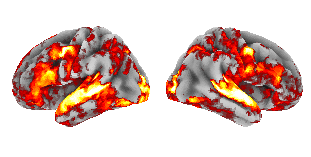
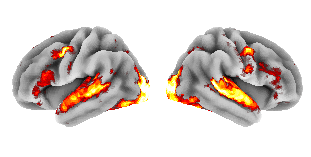
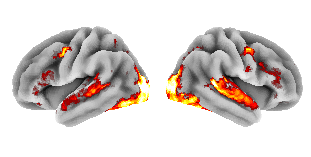
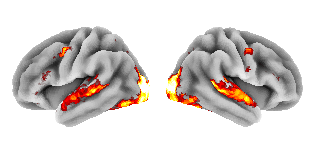
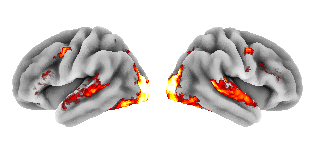
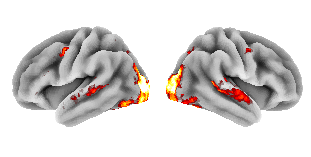
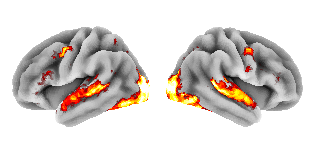
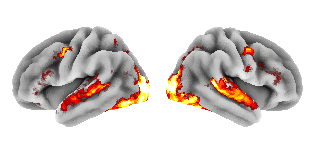
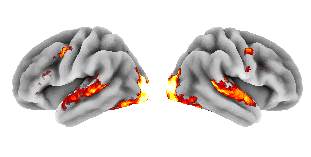
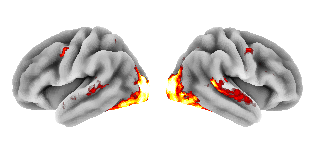
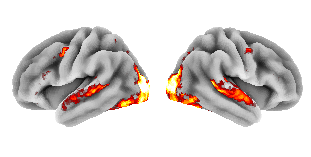
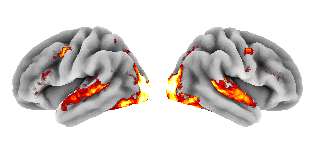
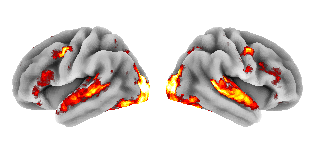
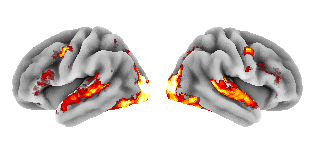
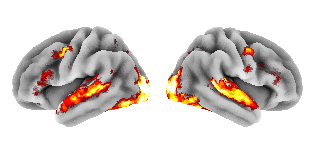
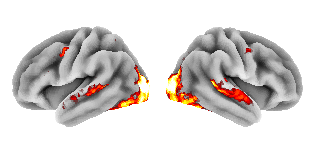
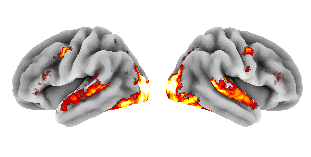
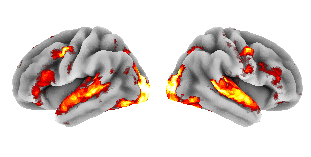
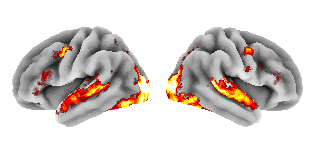
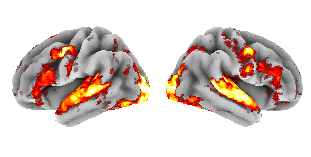
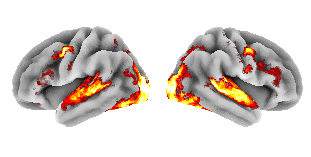
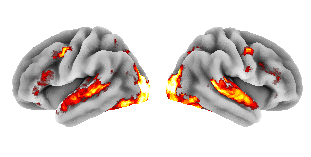
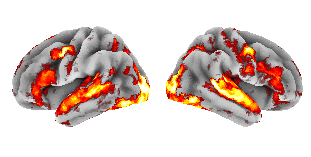
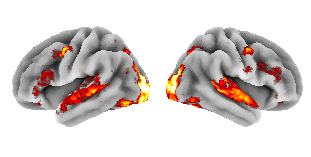
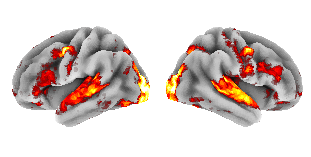
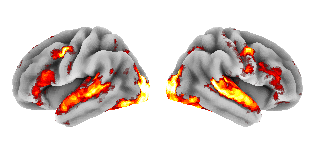
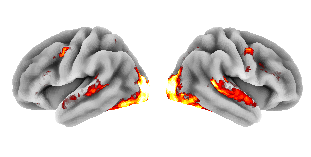
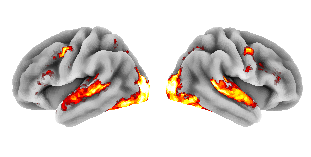
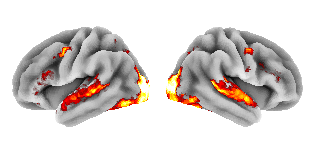
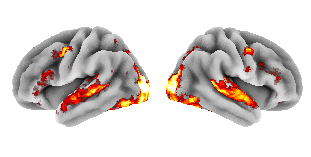
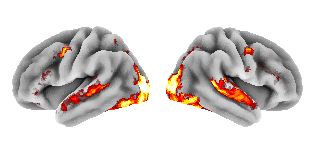
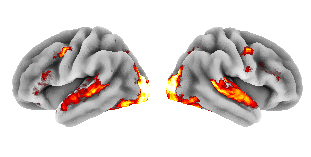
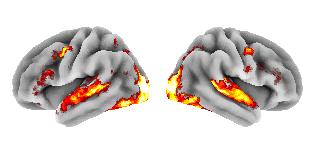
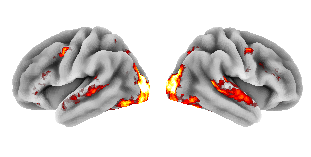
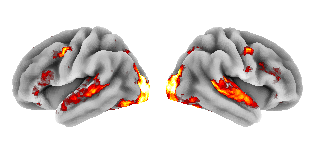
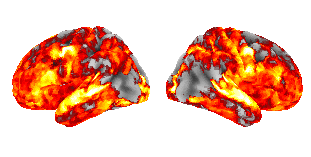
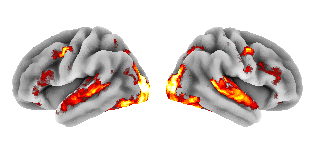
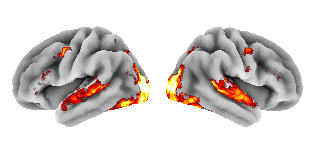
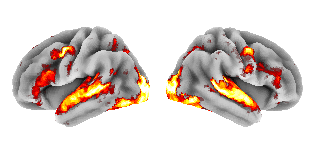
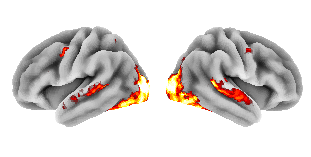
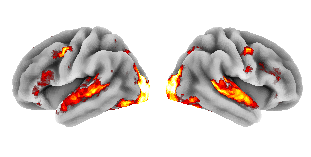
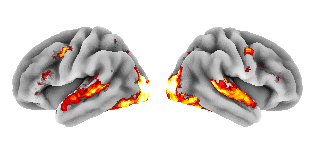
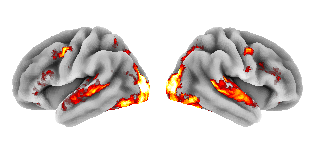
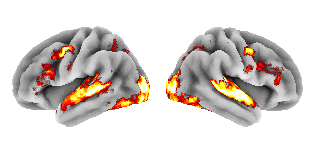
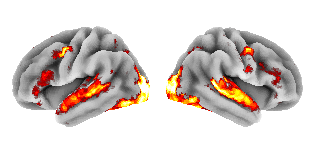
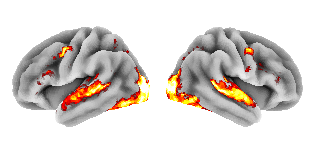
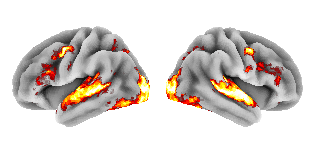
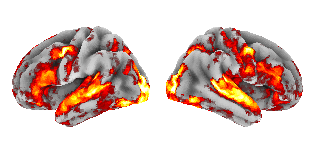
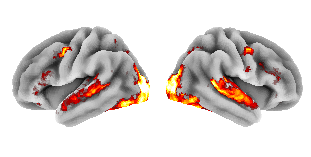
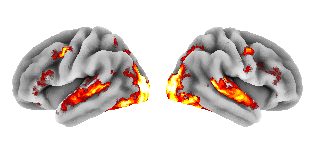
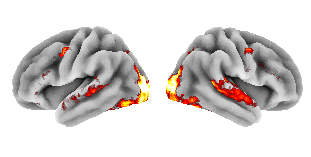
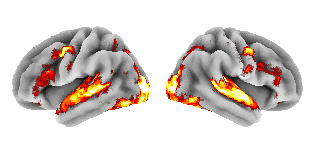
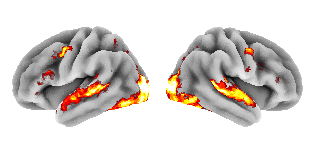
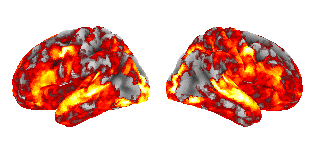
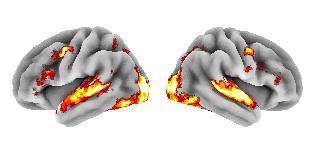
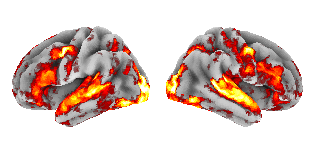
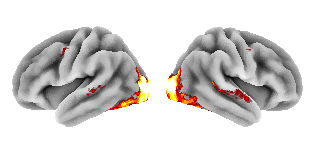
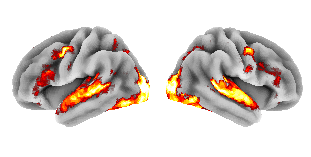
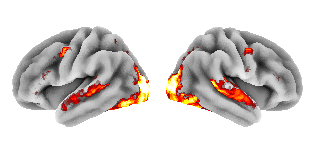
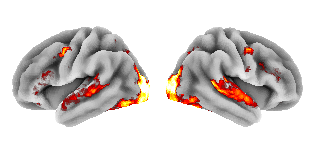
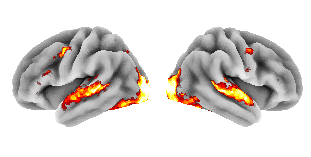
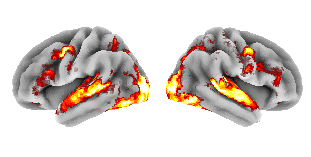
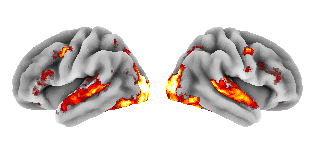
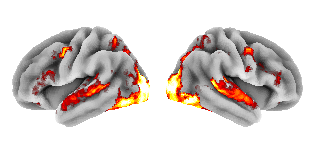
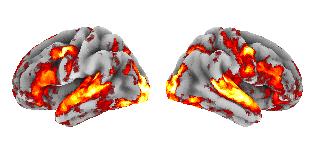
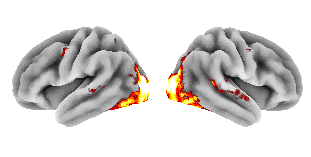
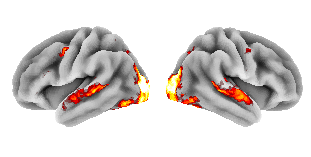
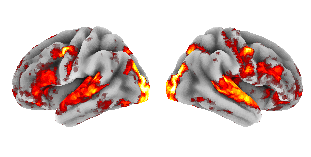
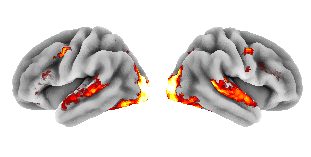
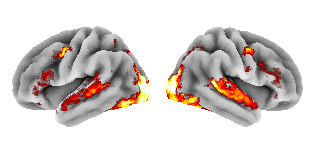
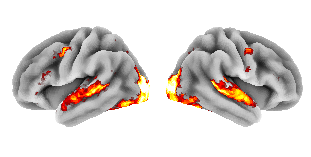
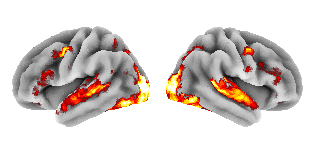
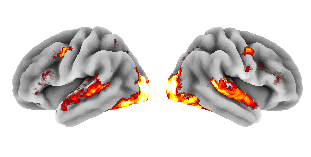
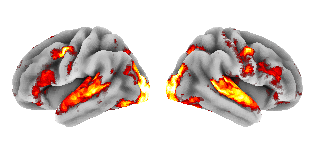
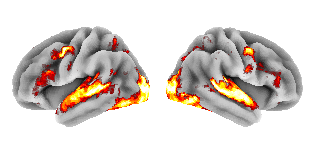
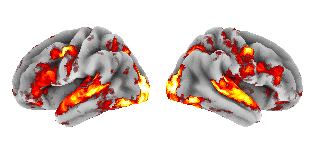
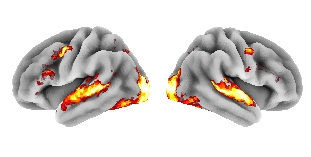
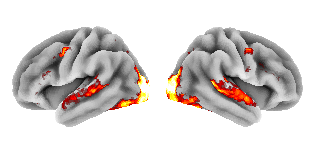
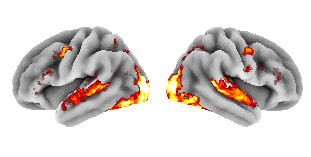
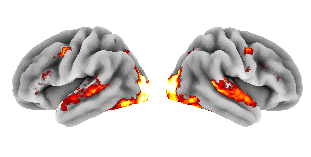
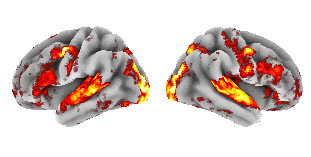
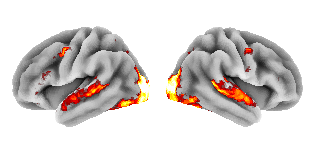
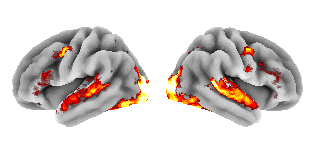
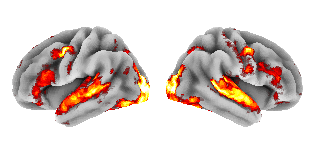
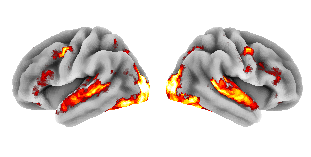
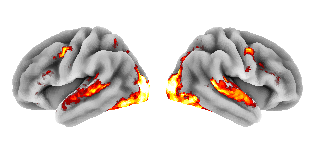
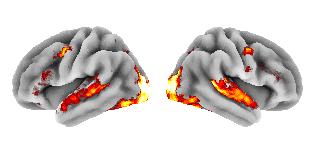
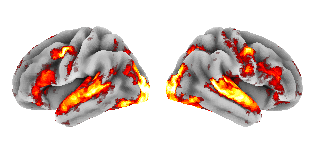
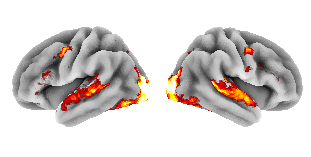
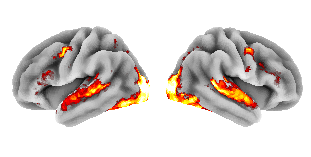
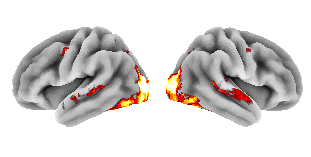
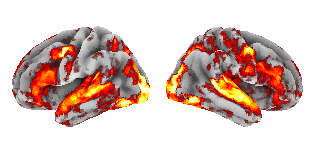
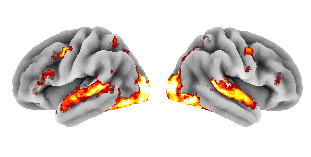
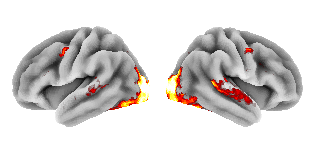
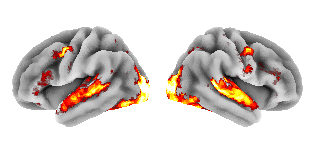
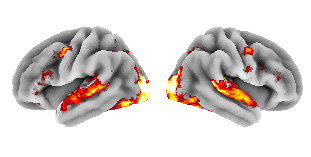
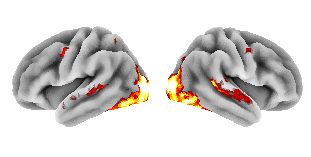
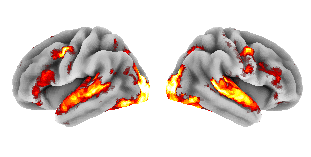
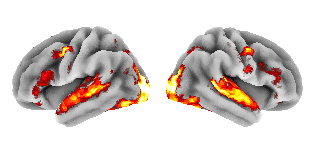
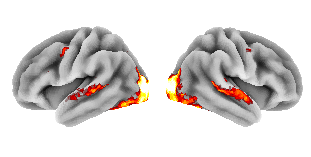
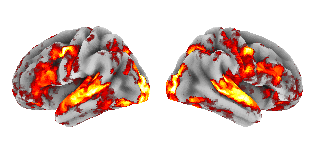
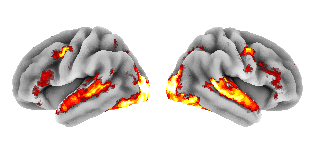
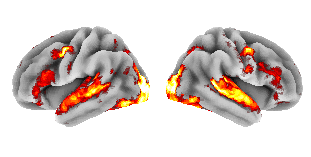
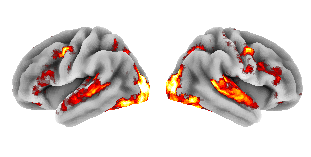
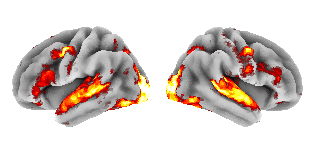
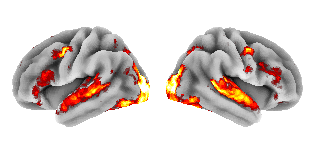
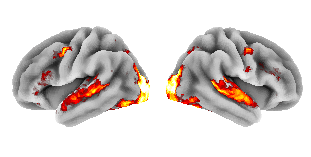
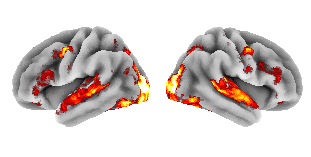
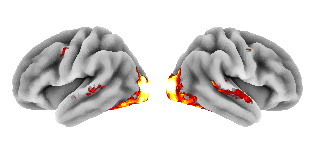
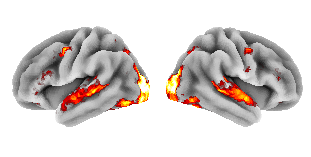
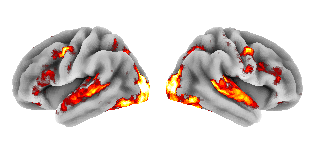
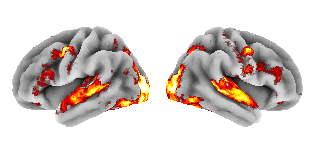
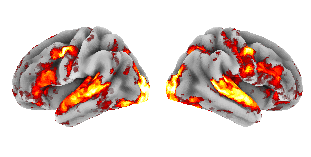
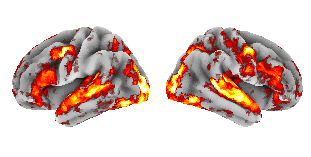
Where does the brain fire most when shown my collection?
Each region's color is its absolute correlation between predicted activation and log(price). Brighter = stronger relationship with what cards cost.
Top correlations
The 10 brain regions whose predicted activation best tracks (or anti-tracks) log(price) across the collection.
Activation vs price
Each dot is a card. X = activation in occipital_L (the strongest single ROI). Y = log of market price. Dashed line is the OLS fit.
The brain's bets
For every card we ranked it two ways: market rank (1 = most expensive in the collection) and brain rank (1 = strongest predicted brain response).
Cards the brain ranks much higher than the market are its hidden gems.
Cards the market ranks much higher than the brain are its skeptics.
Implied price = the actual market price at the brain's ranked position — a more honest projection than the log-regression's dollar output (which compresses everything toward the mean).
Of 213 priced cards, 61 land in "brain likes it more" and 68 in "market likes it more" (|rank diff| ≥ 30).
HIDDEN GEMS

MARKET KNOWS BEST
Every card, ranked by brain-vs-market disagreement
Each card shows its market rank (1 = most expensive of 213) and how the brain ranks it. The corner badge is the rank delta — positive (green) means the brain likes this card more than the market does.


Methodology & caveats
Pipeline. Card catalog images were scraped from a personal Collectr portfolio (catalog product images, not user photos). Each image was wrapped as a 2-second silent MP4 — TRIBE v2's public API takes video, not images directly — and passed to TribeModel.predict. The output is a per-second prediction of the BOLD signal across the ~20,484 vertices of the fsaverage5 cortical mesh. We averaged across timesteps, then partitioned vertices into 14 anatomical regions (occipital / parietal / temporal / sensorimotor / frontal / prefrontal / cingulate × L/R) using each vertex's 3D coordinate, and took the mean activation inside each region.
Statistics. Per-region Pearson r against log(market_price), then a Ridge regression from the 14-dim ROI vector onto log(price), with leave-one-out cross-validation. As a control, we permuted the price column 200 times and re-ran the same LOO regression to get a null distribution of held-out R². The headline number is where the real R² falls in that distribution.
- Correlation isn't causation. Even if predicted neural activation tracks price, the brain doesn't set Pokémon prices — TCG market mechanics do. The honest framing is: visual features that drive predicted brain activation also happen to be visual features that the secondary market values.
- Small N. A few dozen cards is too few to make confident claims. The shuffle control protects against false positives, but real signal could still be a quirk of one collection.
- TRIBE v2 was not trained on Pokémon cards — it was trained on naturalistic media (videos, podcasts, images). Its brain predictions on a static card image are out-of-distribution.
- Static-image artifact. Wrapping a still image as a 2-second silent video means the audio and language extractors see nothing. Only the V-JEPA2 visual stream contributes.
Built with TRIBE v2 (Meta, CC BY-NC). Pipeline source: see the tribev2 demo repo. This page contains a single ~30-line vanilla JS snippet for sort reordering — no framework, no tracking, no analytics.